Posts

Using Full Page Apps in Dynamics 365 Finance

Image
Have you ever wanted to put a website or a model-driven Power App in one of your existing Dynamics 365 Finance workspaces or forms?  You might already know you can create a new workspace with a website, but did you know you can add the website to an existing workspace? Here is an example of the Vendor invoice entry workspace with the Invoice Capture Power App embedded. Prior to using this feature, you need to turn on "Saved views support for workspaces" in feature management. Once this feature is enabled you can follow the following steps to add the Invoice Capture app or any model-driven Power App or website to an existing workspace. Open the vendor invoice entry workspace From Options - choose Personalize this page From personalize menu - select the 3 dots - and then Add an app Once that is selected (the screen goes gray) - click on the section header where you want to add the app (in my example I put it in Links) On the Add an app menu - choose Website Give it a name (my e

Progress Billings with Project Accounting & Sales Orders

Image
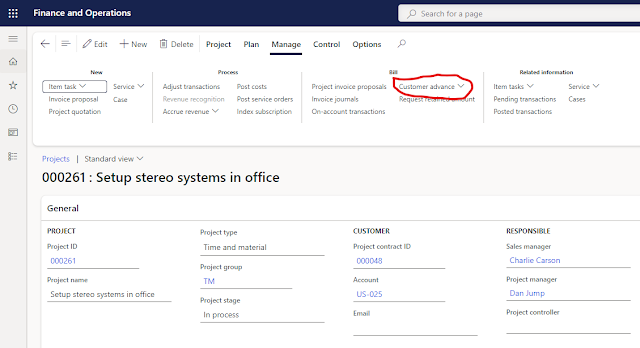
I was recently working with a couple customers that have very large orders and they need to invoice when the order is booked and maybe issue a couple progress invoices while the order is processed.  There are a few ways this can be handled in D365.  Unfortunately, Microsoft disabled the prepayment tab on the sales order tab in version 10.0.14 .  There is currently an idea posted inside the Microsoft ideas portal to add a function to handle prepayments.   Hopefully Microsoft will address this issue in the near future.  However, I needed to find a solution for today, and using Project Accounting seems to give an acceptable solution for managing the progress payments.   The key to this approach is using the Customer Advance on the Project screen.  It is also important to make sure you have setup the proper liability account for the prepayment invoice.  This is done in Project - Setup - Posting - Ledger Posting Setup. To see how this works in action I have put together a demo video.  Hopef

AP Automation in Dynamics 365 Finance and Supply Chain

As a solution architect, prospects and clients often ask me for ways to improve their Accounts Payable process.  They receive hundreds of invoices every month, and it can take considerable amount of time to enter all of the detail as well as attaching the invoice for reference during the approval process.  This is an area where we have often needed to bring in an ISV solution, but that could cause other issues.  Microsoft has been doing considerable work around automation for AP and they recently released a public preview of their Invoice Capture solution. I have had the opportunity to set this up in one of my test environments so I could get an idea of what they have to offer.  As we would expect, the Invoice Capture solution is built on the Power Platform.  It uses a model driven Power App along with Power Automate Flows to integrate with Dynamics 365 Finance.  However, since it is a solution, they have done much of the work for you, including creating the standard flows to load the

Big news from Microsoft on paginated reports

To follow up on my earlier posting about using the right tool for the right job, I had to share the latest announcement from Microsoft.  On November 14, 2022, Microsoft announced support for paginated reports in Power BI Pro.   Yes, this now means without acquiring a premium license or premium workspace, you will be able to create paginated reports.  No longer will you just have a scrolling table or matrix that you have to export to Excel, you will be able to create more traditional operational reports as well as document-like reports. I am excited to see how everyone puts this new functionality to work.  I have a lot of ideas on how I will use this with my clients, especially with some of their common ERP (Dynamics 365) report requests.

Recap of Dynamics Communities Summit 2022

  It has been about a week and a half since I returned from Summit.   This was at least my tenth Summit.   At this point I have lost track, but I certainly remember when there were only a couple hundred people.   A lot has changed in the past couple years.   They are not back to where they were in 2019, but this was a huge improvement over last year in Houston.   With over 600 sessions, there was a lot of content to choose from for the attendees.   Of course, this is both good and bad because which sessions do you attend?   You can’t be everywhere.   Also, there were issues with the event app and seating in many of the rooms, but they tried to address these as the event went on and have promised to learn from their mistakes.   It is an new staff since their last large event, and everyone is still trying to remember how to put on large events like this.   My firm had several clients attend the event, and they were overall happy with the content of the event.   Probably the number one co

What should I use, a hammer or screwdriver???

Image
  Lately, I have been working with several of our team members and clients regarding various reporting needs.   Since I do a lot of work with Power BI, they will bring me in because they believe Power BI is the correct answer.   In most cases, when they think Power BI, they are considering either the free version or Power BI Pro.   In other words, they are looking for a visualization to replace their report.   In many cases, this is possible, but other times there are struggles and issues.   It made me think about the toolbox I have in my garage.   I am not a handyman by any means, but I do have a few of your typical tools including a couple hammers and few screwdrivers so I can take care of various household projects, like hanging a picture, putting together furniture, building all the toys my wife is buying for our granddaughter, etc.   These household projects remind me a lot the various report requests I see from our clients.   Sometimes the report is as simple as hanging a pic

Smart Narratives - a quick and easy way to get your message across

Image
 I was recently working with a client on Power BI visualizations.  We were talking about various visualization techniques as well as the options for Power BI visuals.  As I was going through the different options, I touched on Smart Narrative.  The client had never seen or tried this visualization, so if made me wonder, how many other were not aware of this visualization option and how to use it. The Smart Narrative visualization became generally available in June, 2021.  The purpose of the Smart Narrative visualization is to help quickly summarize visuals and reports by providing relevant out-of-the-box insights that are customizable.  As the name applies, the visual adds narratives to the reports to address key takeaways and point out trends.   Initially, I was not too excited about this visualization, because I often feel a picture is worth a thousand words, so I would rather look at the chart or visualization and draw my own takeaways and trends.  However, I have learned in working