It has been a while since I posted, but I have been getting a lot of questions lately from clients and from my accounting students about the same topic: Where does AI actually belong in the financial reporting process? Everyone wants to know if they should be using it, and the honest answer is that it depends a lot on which part of the process you are talking about. I have been working with several clients on this over the last few months, plus I have an upcoming speaking session on AI in reporting, so I thought I would put some of these thoughts together here. For each point, I am also going to push back on myself a little, because I think that is a more useful way to think through this than just picking a side. Where AI is actually helping right now The clearest win I have seen is variance analysis. AI tools are good at scanning through a large number of GL lines and flagging the ones that look different from what history would predict. Think of a vendor payment that...
Changes are coming...
- Get link
- X
- Other Apps
I will be the first to admit, I do not blog that much. Unfortunately, work and life sometimes get in the way. As we start 2021, I am going to make an effort to add more to this blog. With this increased effort in blogging, I will also be increasing the topics that I will cover. While I will still be covering Business Intelligence and Power BI, I will also be covering topics on Power Platform and Microsoft Dynamics 365.
With this change, I am also going to move the blog to a new address www.danscorner.info. This change will take place very soon. Keep checking back for the new posts, and if you have some areas you would like me to cover, feel free to add a comment below.
- Get link
- X
- Other Apps
Popular posts from this blog
Showing the last 12 months based on a date slicer
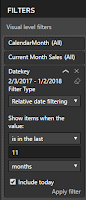
When working with financial and sales data, clients often ask for charts showing the last 12 months of data. This is actually very simple using relative date filtering. In addition, they might ask to compare to the same month last year. With a simple DAX calculation (SAMEPERIODLASTYEAR) it is possible to add this measure. Here is the formula: Same Month Last Year = CALCULATE(Sum(Sales[SalesAmount]),SAMEPERIODLASTYEAR('Date'[Datekey])) For many users this is all they need. The chart will update each month and they will always be able to see the last 12 months. However, this chart will not work with date slicers. If the client adds a date slicer to the page and selects just one month, the chart will be limited to one month. The reason the chart is limited to one month is because the date dimension relates to the sales fact table and it filters the data for the selected month. Howe...
Adding a new entity to Dual-write in Dynamics 365 Finance
As Microsoft continues to grow, expand and improve Dynamics 365 Finance and Supply, one of the most powerful features released has been Dual-write. Dual-write is an out-of-box infrastructure the provides near-real-time interaction between customer engagement apps and Finance and Supply Chain apps. In summary, it is a tightly coupled, bidirectional integration between Finance and Supply Chain applications and Dataverse (formally known as Common Data Service). Dual-write makes integration with Dynamics 365 Sales and other CE application very straight forward. It also opens up the opportunities to use PowerApps, Power Portal and Power Virtual Agent with Dynamics 365 Finance and Supply Chain apps by connecting through the Dataverse. There is already documentation from Microsoft as well as many blogs already available on setting up Dataverse. Here are a few links: Microsoft Documentation Dynagile Consulting Sandeep Chaudhury ERP Coder Blog Instead...
Business Analytics and Visualization
It has been a while since I posted a blog article. Things have been busy and unfortunately my blog has suffered. Not only have I been busy working in the Microsoft Dynamics 365 and Power Platform arena, but I have also been teaching at a local university. This past semester I taught Business Analytics and Visualization. It was a fun course to teach and I was able to introduce business students to the power of analytics using both Power BI and Tableau. The text for the course was Introduction to Business Analytics, 1 st Edition by Vernon Richardson & Marci Watson. The text did a great job of covering the types of analytics and the mindset and approach you should follow as a business analyst. I recently used some of this material in a presentation at an FPnA conference, and it was well received, so I thought I would put the thoughts together here for everyone to read. In today's data-driven world, the ability to transform raw data into meanin...
Comments
Post a Comment