Posts

Showing posts with the label #SmartNarratives

AI in Financial Reporting

It has been a while since I posted, but I have been getting a lot of questions lately from clients and from my accounting students about the same topic:  Where does AI actually belong in the financial reporting process?  Everyone wants to know if they should be using it, and the honest answer is that it depends a lot on which part of the process you are talking about. I have been working with several clients on this over the last few months, plus I have an upcoming speaking session on AI in reporting, so I thought I would put some of these thoughts together here. For each point, I am also going to push back on myself a little, because I think that is a more useful way to think through this than just picking a side. Where AI is actually helping right now The clearest win I have seen is variance analysis. AI tools are good at scanning through a large number of GL lines and flagging the ones that look different from what history would predict. Think of a vendor payment that...
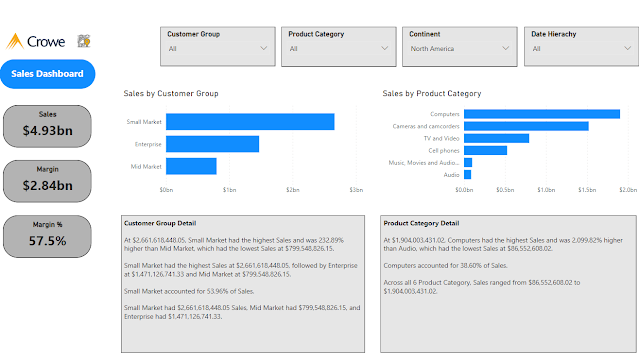
Smart Narratives - a quick and easy way to get your message across

Image
 I was recently working with a client on Power BI visualizations.  We were talking about various visualization techniques as well as the options for Power BI visuals.  As I was going through the different options, I touched on Smart Narrative.  The client had never seen or tried this visualization, so if made me wonder, how many other were not aware of this visualization option and how to use it. The Smart Narrative visualization became generally available in June, 2021.  The purpose of the Smart Narrative visualization is to help quickly summarize visuals and reports by providing relevant out-of-the-box insights that are customizable.  As the name applies, the visual adds narratives to the reports to address key takeaways and point out trends.   Initially, I was not too excited about this visualization, because I often feel a picture is worth a thousand words, so I would rather look at the chart or visualization and draw my own takeaways and tren...