Posts

Showing posts with the label DAX

AI in Financial Reporting

It has been a while since I posted, but I have been getting a lot of questions lately from clients and from my accounting students about the same topic:  Where does AI actually belong in the financial reporting process?  Everyone wants to know if they should be using it, and the honest answer is that it depends a lot on which part of the process you are talking about. I have been working with several clients on this over the last few months, plus I have an upcoming speaking session on AI in reporting, so I thought I would put some of these thoughts together here. For each point, I am also going to push back on myself a little, because I think that is a more useful way to think through this than just picking a side. Where AI is actually helping right now The clearest win I have seen is variance analysis. AI tools are good at scanning through a large number of GL lines and flagging the ones that look different from what history would predict. Think of a vendor payment that...
Covid Dashboard - Article 6 - Creating a group for a slicer

Image
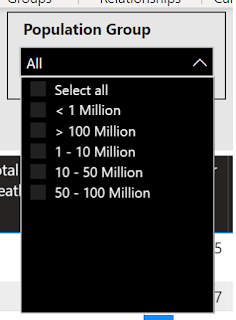
I will continue to build on my earlier posts about my  COVID19 Dashboard .    In this series, I have written a few different blog articles describing not only how I built it, but some things I learned in the process. The current list of topics include: Working with growing CSV files Using index and merge when transforming data Using time functions to calculate the daily change Reporting based on the population Working with maps, setting data types correctly Today I am going to look at a question one person asked me.  When they were using the dashboard, they wanted to be able to filter the global results by countries of similar size. After thinking about this for a while, I decided on the following approach.  There are probably different approaches that can be used, and that is one of the things I really like about Power BI.  In this case, I tried to take a very simple approach. Step 1 - I had to decide how I wanted to group the count...

USERELATIONSHIP in DAX

Image
A common problem many users face it the fact that there are multiple date fields in their tables, and when they want to use a date dimension, Power BI only allows for on active relationship between the two tables. For example, I have a dimension table from my leasing software that included information on each lease including the commencement date of the lease and the expiration date of the lease.   In Power BI when I use a separate date dimension (which I always recommend for many different reasons), I can only link the dimension table to date table with one active relationship.    See screen shot below. Since most of my visualizations will be based on the Commencement Date, I will make that the active relationship.   However, I would like to create a visualization showing my leases by expiration date.   In order to do this, I have a couple options. 1.        I could create a second date dimension table in my...