It has been a while since I posted, but I have been getting a lot of questions lately from clients and from my accounting students about the same topic: Where does AI actually belong in the financial reporting process? Everyone wants to know if they should be using it, and the honest answer is that it depends a lot on which part of the process you are talking about. I have been working with several clients on this over the last few months, plus I have an upcoming speaking session on AI in reporting, so I thought I would put some of these thoughts together here. For each point, I am also going to push back on myself a little, because I think that is a more useful way to think through this than just picking a side. Where AI is actually helping right now The clearest win I have seen is variance analysis. AI tools are good at scanning through a large number of GL lines and flagging the ones that look different from what history would predict. Think of a vendor payment that...
Microsoft Convergence is back
- Get link
- X
- Other Apps
It has been over 10 years since Microsoft hosted their Convergence conference for Microsoft business applications. It is happening in Miami, FL on December 10th & 11th. I am lucky to be attending and also presenting a session. My session will be Using Power Platform to automate the accounting department in Dynamics 365 Finance. Hopefully you will be attending and have an opportunity to join my session.
I am posting my slides here, so if you attend and want the slides, you can get them here. Using Power Platform slides Even if you are unable to make the session, feel free to download my slides.
- Get link
- X
- Other Apps
Popular posts from this blog
Showing the last 12 months based on a date slicer
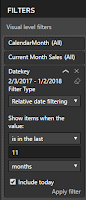
When working with financial and sales data, clients often ask for charts showing the last 12 months of data. This is actually very simple using relative date filtering. In addition, they might ask to compare to the same month last year. With a simple DAX calculation (SAMEPERIODLASTYEAR) it is possible to add this measure. Here is the formula: Same Month Last Year = CALCULATE(Sum(Sales[SalesAmount]),SAMEPERIODLASTYEAR('Date'[Datekey])) For many users this is all they need. The chart will update each month and they will always be able to see the last 12 months. However, this chart will not work with date slicers. If the client adds a date slicer to the page and selects just one month, the chart will be limited to one month. The reason the chart is limited to one month is because the date dimension relates to the sales fact table and it filters the data for the selected month. Howe...
Copilot Dynamics 365 Finance & Supply
Microsoft has recently released two Copilot applications to work with Dynamics 365 Finance & Supply Chain. These solutions are still in preview, so it should only be uses in sandbox environments to evaluate and learn how they will work with your organization. Prior to installing it is important to make sure your environment meets the requirements. Dynamics 365 Finance & Supply Chain requires the latest hotfix on Dynamics 365 Finance version 10.0.34 (10.0.1591.107) and version 10.0.35 (10.0.1627.70) and later. In addition, the solutions rely on the Power Platform and Dataverse, so it is important to have the environments connected and user security set appropriately. For more details on the prerequisites and the installation instructions you can follow the Microsoft installation documents. Copilot in Microsoft Dynamics 365 Finance Copilot in Microsoft Dynamics 365 Supply Chain Let's look at what these two copilots provide to users Copilot in Microsoft Dynamics 365 Finance C...
RPA with Dynamics 365 Finance & Supply Chain
Are you looking for ways to automate some of your routine accounting functions, like reconciling sub ledgers to the general ledger? Microsoft has recently created some examples using Power Automate Desktop (think of it like Task Recording on steroids). It can not only automate steps through Dynamics 365, but it can also automate Excel and other applications. In one example from Microsoft they automate the AR to GL reconciliation: Automatic running of the AR aging and the customer/ledger reconciliation reports. Power Automate then extracts data from both reports in Excel and compares the balances. Power Automate then posts a Team message letting you know the subledger is in balance. Power Automate saves the reports with the date in the file name, so there is backup. Microsoft Directions & Example I working with the example, I needed to make a couple of adjustments to the sample flow that was provided but I was able to get it to work. Here is a video of the flow r...
Comments
Post a Comment